Prometheus
Prometheus is a widespread open-source software package for monitoring and alerting. It collects metrics from configured targets at given intervals to populate its internal timeseries database. PromQL queries can then be run against the timeseries data to display results. Rules allow to specify conditions for generating alarm events, which can be handled by the Alertmanager module to e.g notify and silence alarms.
Integration
Sipfront provides "exporter" API endpoints for Prometheus to scrape test results and metrics. This allows you to integrate specific Sipfront tests into your own Prometheus, display them in your existing dashboards and alert using your existing alerting mechanisms.
Concept
The Prometheus exporter represent HTTP API endpoints to monitor specific Sipfront tests, and also whole projects containing multiple tests.
Test level endpoints
A test level endpoint allows you to scrape the measures and result status of the recurring runs of one particular test over time. There are three different types of endpoints:
- Gauges: scrape measure value/avg
https://app.sipfront.com/prometheus/tests/<testid>/gauges
- Summaries: scrape measure quantiles (median, p95, ...)
https://app.sipfront.com/prometheus/tests/<testid>/summaries
- Status: scrape result status (passed/failed)
https://app.sipfront.com/prometheus/tests/<testid>/status/hourhttps://app.sipfront.com/prometheus/tests/<testid>/status/minutehttps://app.sipfront.com/prometheus/tests/<testid>/status/day
Gauges
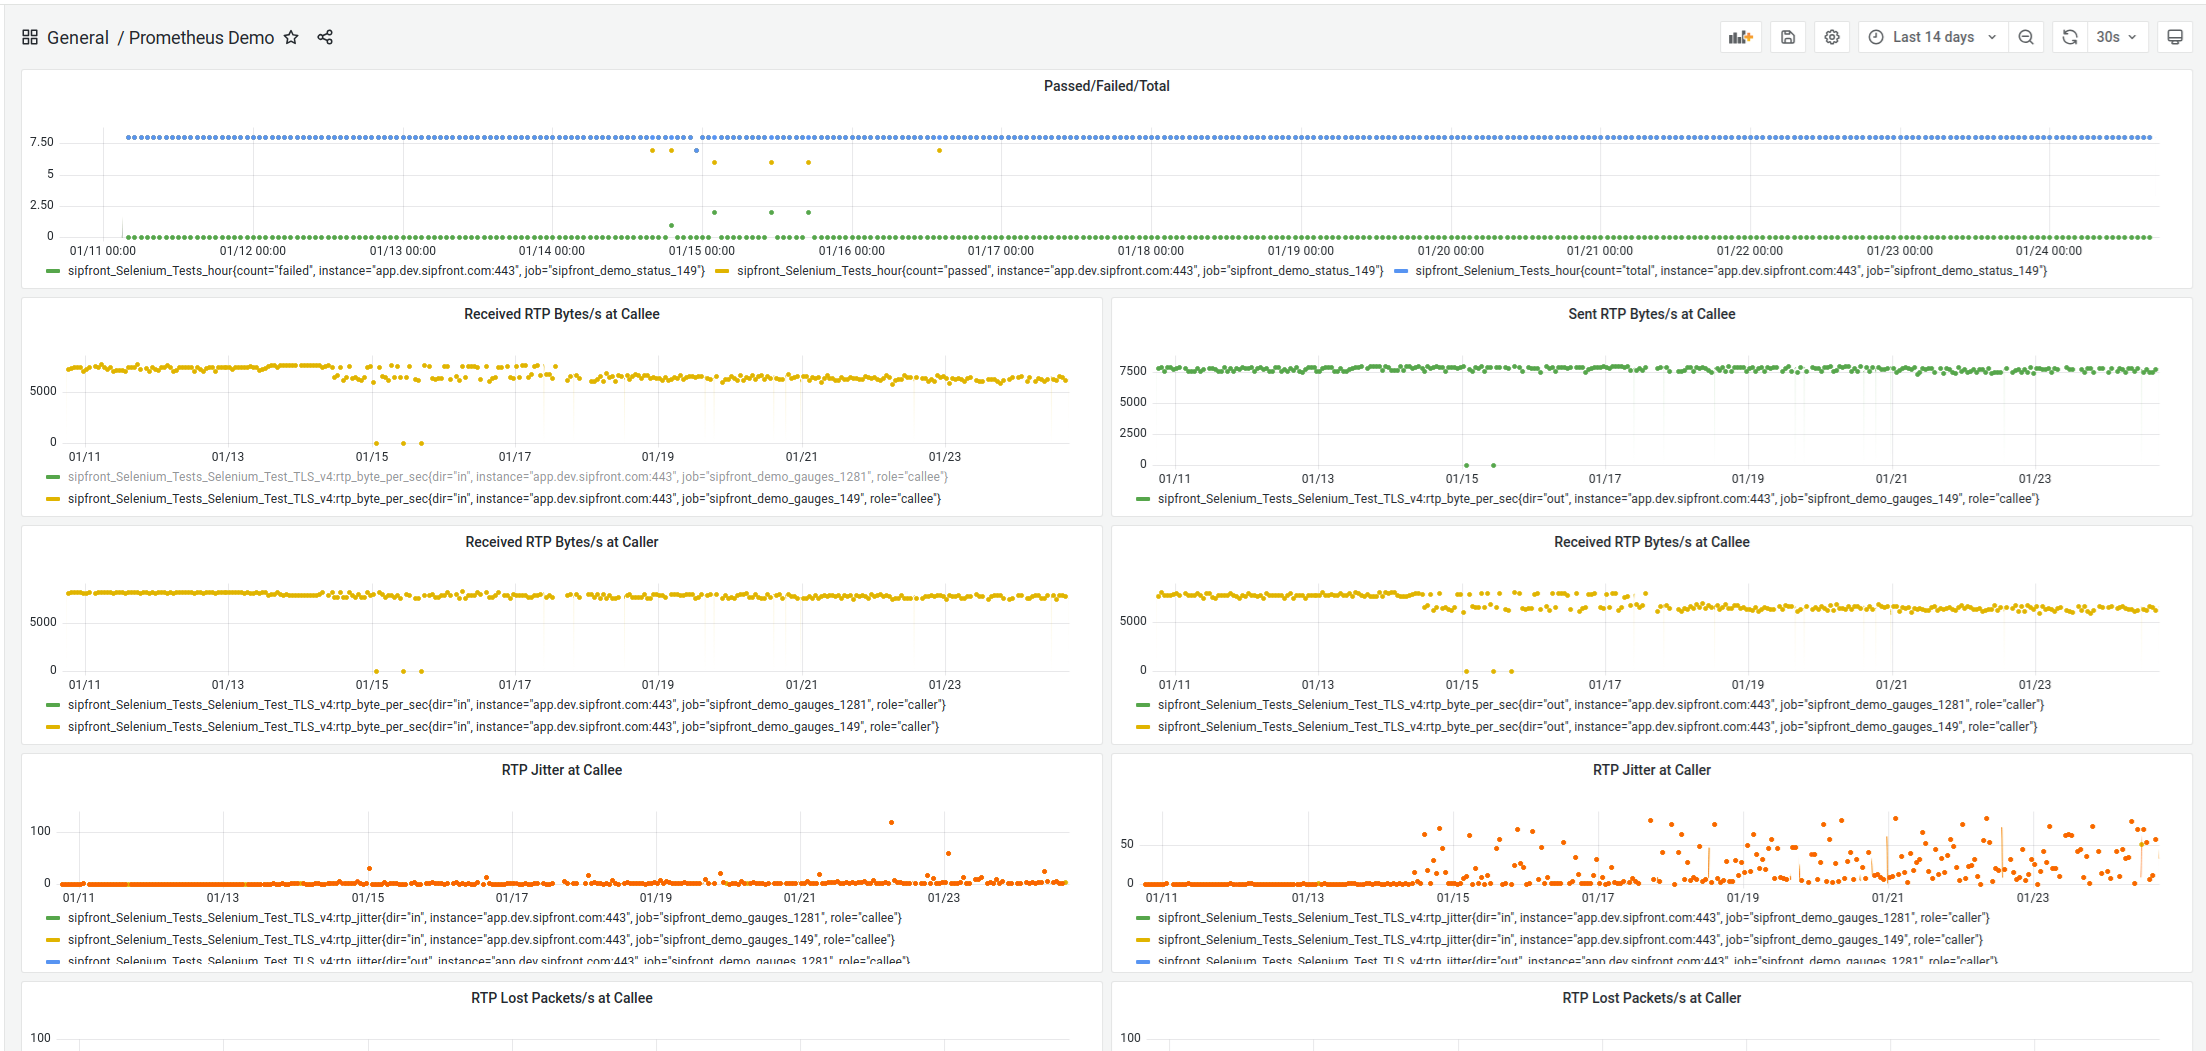
Gauges export endpoints allow you to capture all the measure values over time in Prometheus, and plot relevant graphs in your Grafana instance to view how certain metrics evolve during the time of day or the week. Similar to graphs in the Sipfront WebApp UI, you will be able to see edges and anomalies quickly, as they may happen after configuration or infrastucture changes in your systems.
A gauge provides the measure value together with the time of the most recent run of a particular test:
visqolRecorded Audio MOS (Visqol)transcribeSpeech-to-text transcription confidence
Below gauges for RTP measures provide the average value across all test agent instances involved with the test run:
rtp_rttRound trip timertp_mosNetwork MOS
Below gauge for RTP and SIPP measures provide the sum value of all test agent instances involved with the test run:
rtp_byte_per_secSent and received bytes per secondrtp_jitterJitterrtp_lostLost packets countrtp_lost_per_secLost packets per secondrtp_pkt_per_secSent and received packets per secondsipp_call_rateCalls per secondsipp_concurrent_callsConcurrent call loadsipp_failed_callsFailed call count
A measure value can be present multiple times, ie. for each involved call party. Therefore value dimensions are provided depending on the measure:
rolefor call party:callercalleeA,B,C, ...
dirfor call direction:inout
confidencefor transcription confidence:minmaxavg
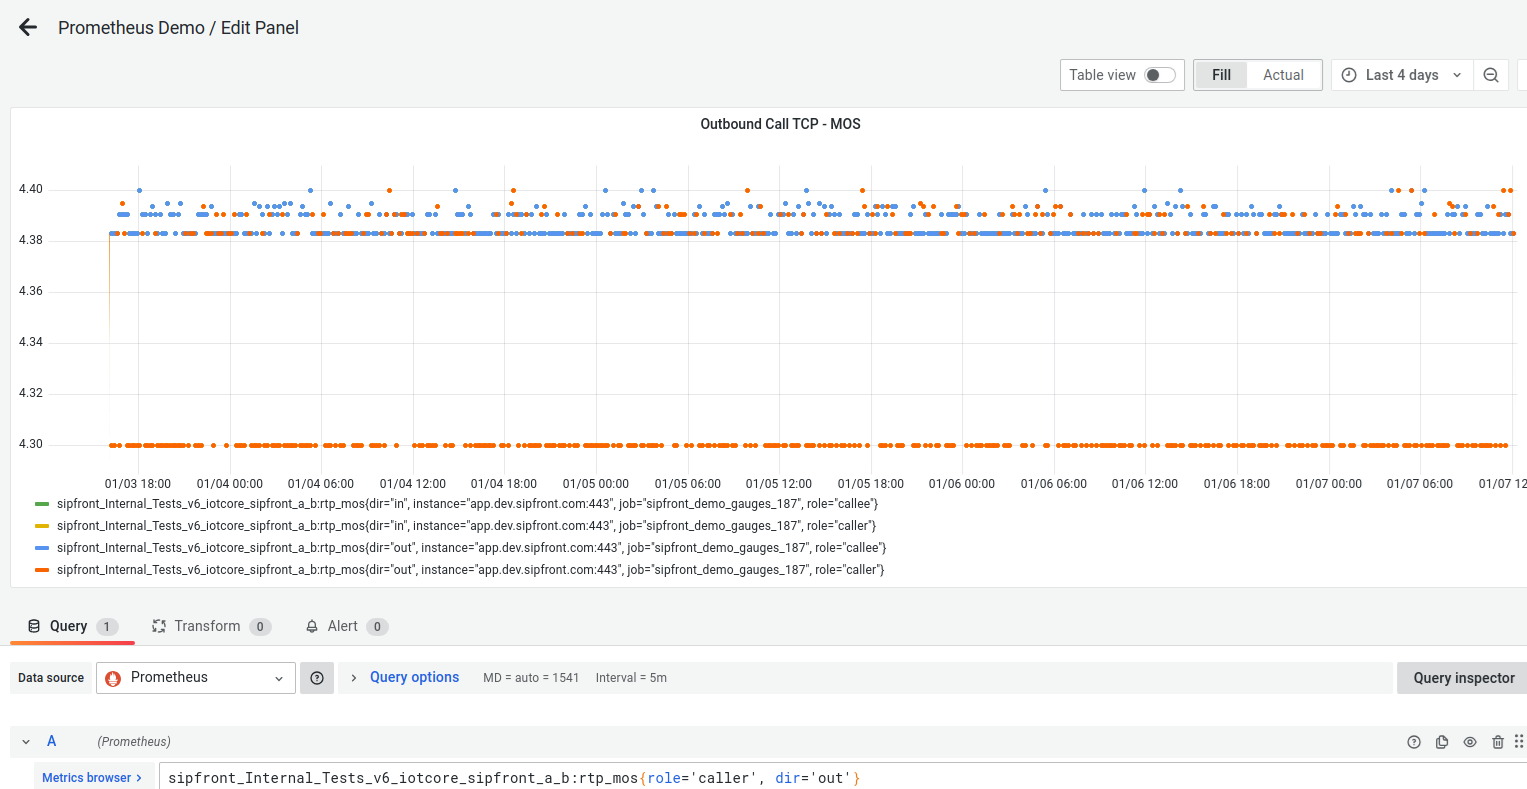
Scraped metric names and dimensions can be explored in the Prometheus/Grafana UI. The exported metric names for prometheus follow a canonical format:
sipfront_Internal_Tests_v6_iotcore_sipfront_a_b:rtp_mos
sipfront: namespace prefixInternal_Tests: sanitized project name 'Internal Tests'v6_iotcore_sipfront_a_b: sanitized test name 'v6_iotcore_sipfront_a_b'rtp_mos: measure
Note
Prometheus basically takes the scrape time as measurement time.
Summaries
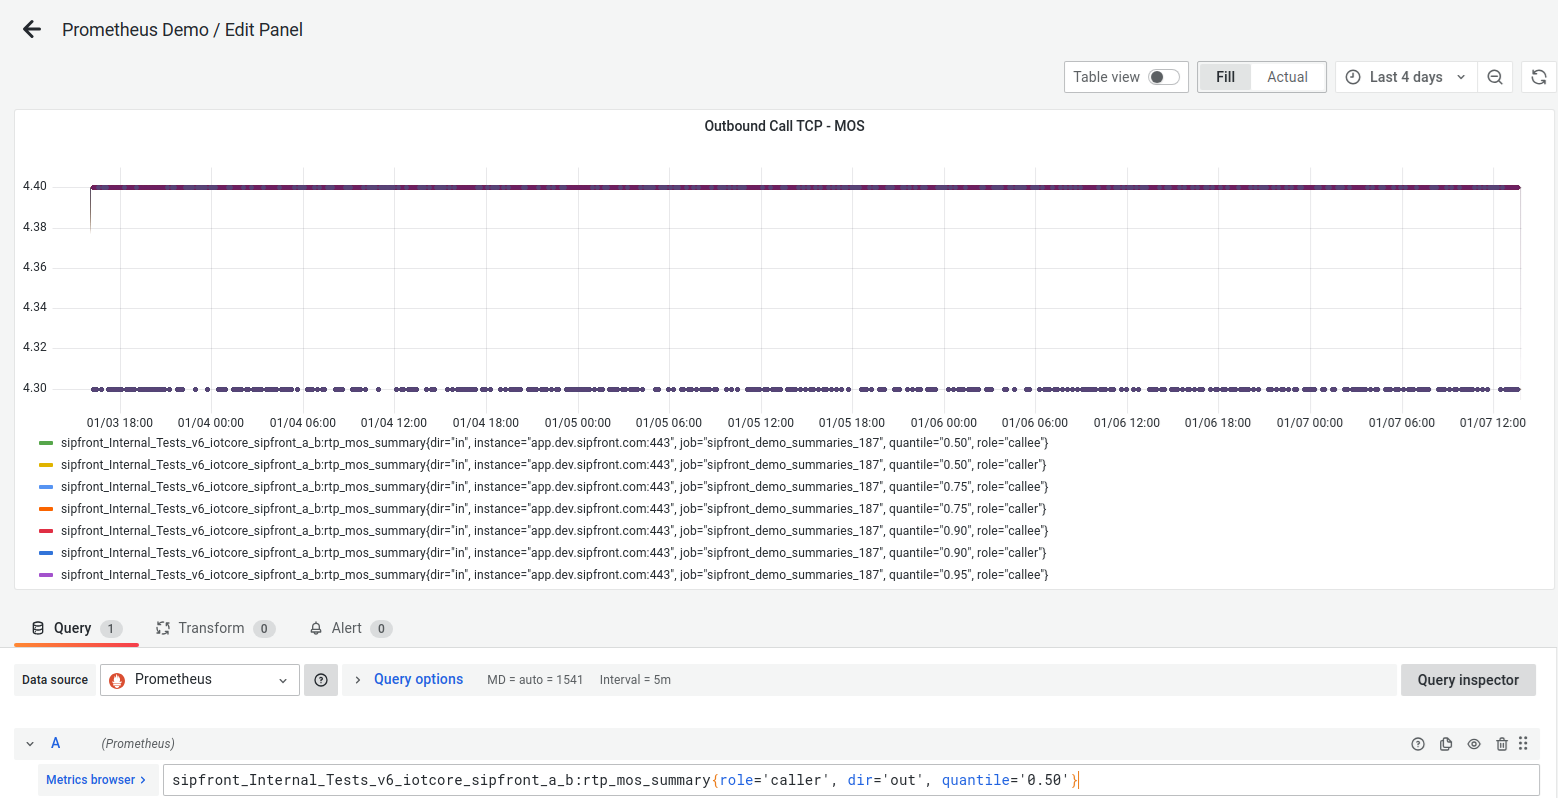
While gauges for rtp_rtt, rtp_mos, rtp_byte_per_sec, rtp_jitter, rtp_lost, rtp_lost_per_sec, rtp_pkt_per_sec, sipp_call_rate, sipp_concurrent_calls and sipp_failed_calls report the average measure value over the test run, there are also corresponding summary endpoints which include the pre-calculated median, p75, p90 and p95 quantiles as additional dimension.
The exported metric summary names for prometheus follow a canonical format:
sipfront_Internal_Tests_v6_iotcore_sipfront_a_b:rtp_mos_summary
sipfront: namespace prefixInternal_Tests: sanitized project name 'Internal Tests'v6_iotcore_sipfront_a_b: sanitized test name 'v6_iotcore_sipfront_a_b'rtp_mos: measuresummary: summary measure suffix
Status
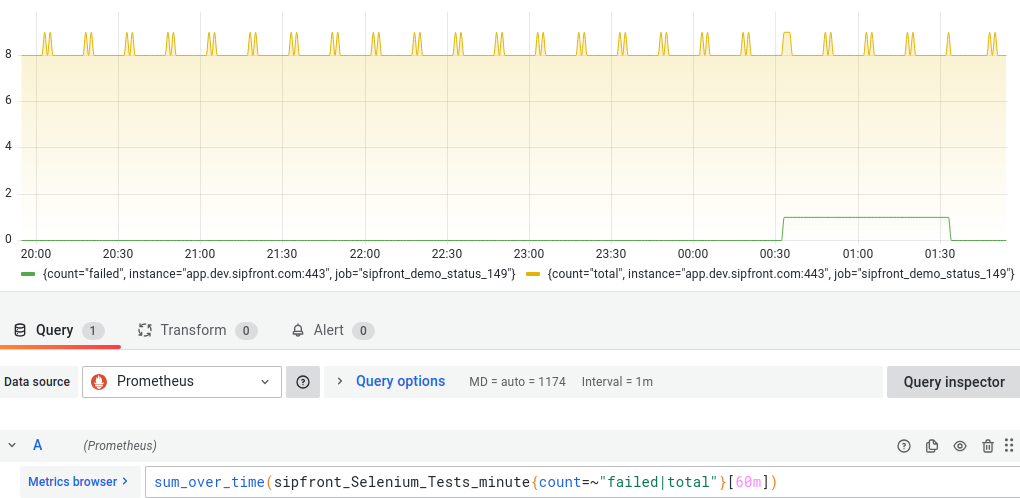
Status endpoints provide you with the number of successful and failed test runs over the last minute, hour or day, depending on the endpoint url. It is also possible to choose any odd time bins such as 7minutes or 9hour, ie.
* `https://app.sipfront.com/prometheus/tests/<testid>/status/7minutes`
* `https://app.sipfront.com/prometheus/tests/<testid>/status/9hour`
This allows you to track test results over time and set alarms if the number of failed test runs during a specific time period exceeds a certain threshold. By Default the session start time is considered for binning, counting by sesstion stop time can be specified explicitly, ie.
* `https://app.sipfront.com/prometheus/tests/<testid>/status/7minutes/stopped_at`
* `https://app.sipfront.com/prometheus/tests/<testid>/status/9hour/stopped_at`
The status endpoint is a gauge that reports the run count values using dimensions:
totaltotal number of runs started during the last fullminute,hourordaypassednumber of runs passing the Sipfront test conditions, started during the last fullminute,hourordayfailednumber of runs failing the Sipfront test conditions, started during the last fullminute,hourorday
The exported metric names for prometheus follow a canonical format:
sipfront_Selenium_Tests_Selenium_Test_UDP_v4_minute
sipfront: namespace prefixSelenium_Tests: sanitized project name 'Internal Tests'Selenium_Test_UDP_v4: sanitized test name 'Selenium Test UDP v4' (n/a for project level status endpoint)minute: endpoint periodminute,hourorday
Note
The project level status endpoints will provide the cumulated results of all tests of the project (sum of total/successful/failed runs).
Project level endpoints
A project level endpoint allows you to scrape measures and result status of the recurring runs of all project tests over time. There are the same types of endpoints:
-
Gauges: scrape measure value/avg of each test
-
https://app.sipfront.com/prometheus/projects/<projectid>/gaugesFor a project containing 3 tests, this is quivalent to scraping the 3 individual test level gauge endpoints, ie.
https://app.sipfront.com/prometheus/tests/<test1id>/gaugeshttps://app.sipfront.com/prometheus/tests/<test2id>/gauges
https://app.sipfront.com/prometheus/tests/<test3id>/gauges
-
-
Summaries: scrape measure quantiles (median, p95) of each test
-
https://app.sipfront.com/prometheus/projects/<projectid>/summariesFor a project containing 3 tests, this is quivalent to scraping the 3 individual test level summaries endpoints, ie.
https://app.sipfront.com/prometheus/tests/<test1id>/summarieshttps://app.sipfront.com/prometheus/tests/<test2id>/summaries
https://app.sipfront.com/prometheus/tests/<test3id>/summaries
-
-
Status: scrape cumulated result status (passed/failed) of all project tests
https://app.sipfront.com/prometheus/projects/<projectid>/status/hourhttps://app.sipfront.com/prometheus/projects/<projectid>/status/minute-
https://app.sipfront.com/prometheus/projects/<projectid>/status/dayFor a project containing 3 tests, this is quivalent to scraping the 3 individual test level status endpoints, ie.
https://app.sipfront.com/prometheus/tests/<test1id>/status/minutehttps://app.sipfront.com/prometheus/tests/<test2id>/status/minute
https://app.sipfront.com/prometheus/tests/<test3id>/status/minute
and querying the sum using a PromQL expression (sipfront_project_test1_minute + sipfront_project_test2_minute + sipfront_project_test3_minute)
-
Status: scrape individual result status (passed/failed) of all project tests
https://app.sipfront.com/prometheus/projects/<projectid>/tests/status/hourhttps://app.sipfront.com/prometheus/projects/<projectid>/tests/status/minutehttps://app.sipfront.com/prometheus/projects/<projectid>/tests/status/day
Configuration
Integrating Sipfront tests into your prometheus requires two things:
- A Sipfront API key
- The Sipfront test ID or project ID
Obtain an API key
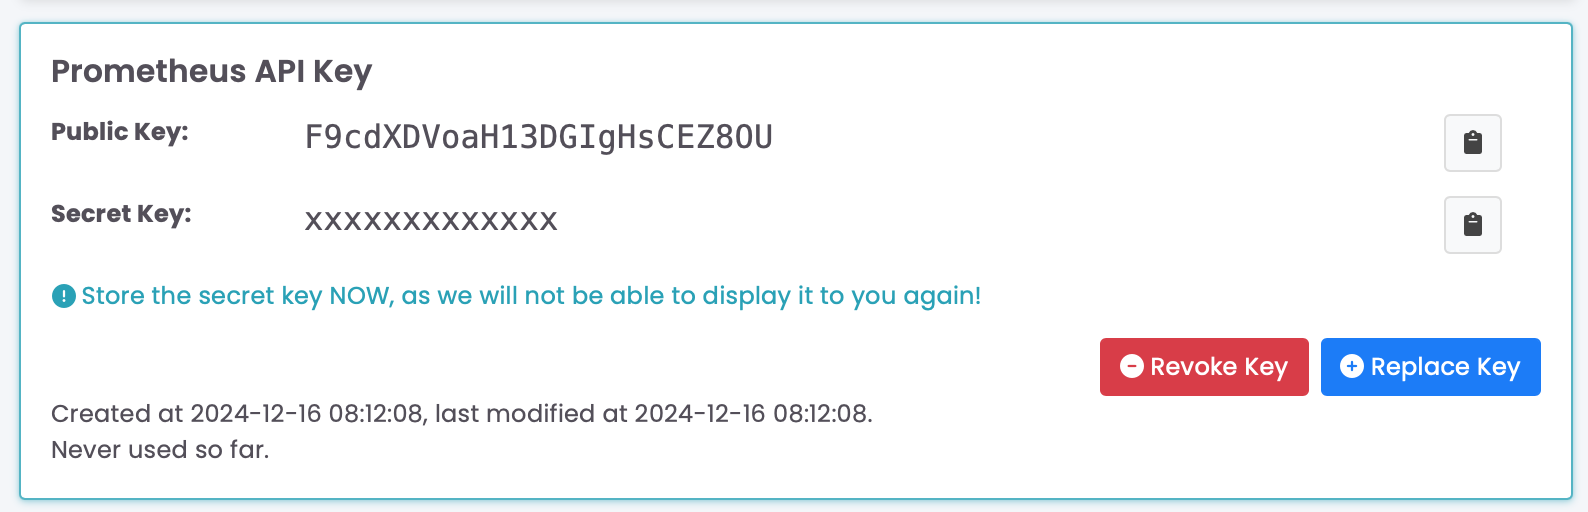
In order to scrape the test results, you need an API key to authenticate with the Sipfront API. You can create an API key in the Sipfront web interface under Account -> API Keys:
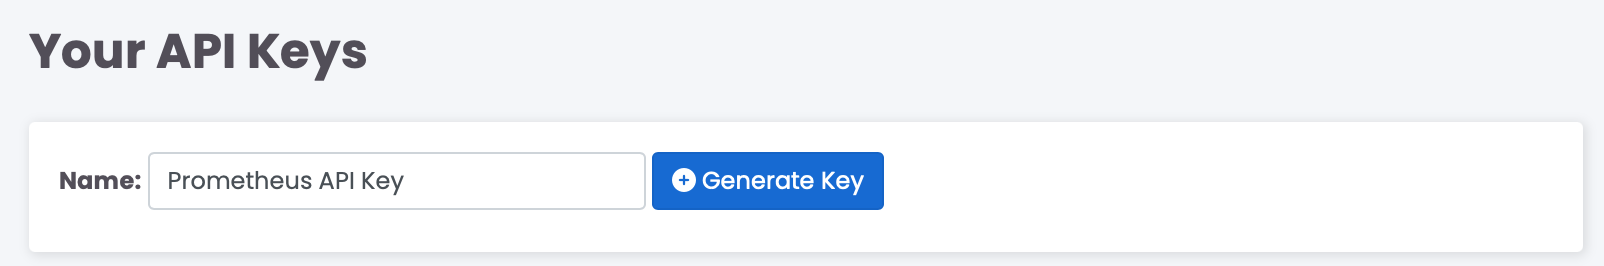
Once created, copy/paste the public key (the username for prometheus) and the secret key (the password) and use it in the configuration below.
Configure Prometheus
To configure Prometheus to scrape Sipfront test results and metrics, you need to add scrape jobs to your prometheus.yml as shown in the examples below.
Note
Prometheus scrape jobs allow to specify the scrape interval, which needs to be aligned to the frequency of your Sipfront test. To avoid loosing information because of aliasing, make sure to configure a scrape interval that is (less than) half of the test recurrence interval.
Configure a test level gauges scrape job
  - job_name: sipfront_test_99_gauges
    scheme: https
    scrape_interval: 60s
    scrape_timeout: 50s
    metrics_path: /prometheus/tests/99/gauges
    basic_auth:
      username: your-public-api-key
      password: your-secret-api-key
    static_configs:
      - targets: ['app.sipfront.com']
Configure a project level gauges scrape job
  - job_name: sipfront_project_77_gauges
    scheme: https
    scrape_interval: 60s
    scrape_timeout: 50s
    metrics_path: /prometheus/projects/77/gauges
    basic_auth:
      username: your-public-api-key
      password: your-secret-api-key
    static_configs:
      - targets: ['app.sipfront.com']
Configure a test level summaries scrape job
  - job_name: sipfront_test_99_summaries
    scheme: https
    scrape_interval: 60s
    scrape_timeout: 50s
    metrics_path: /prometheus/tests/99/summaries
    basic_auth:
      username: your-public-api-key
      password: your-secret-api-key
    static_configs:
      - targets: ['app.sipfront.com']
Configure a project level summaries scrape job
  - job_name: sipfront_project_77_summaries
    scheme: https
    scrape_interval: 60s
    scrape_timeout: 50s
    metrics_path: /prometheus/projects/77/summaries
    basic_auth:
      username: your-public-api-key
      password: your-secret-api-key
    static_configs:
      - targets: ['app.sipfront.com']
Configure a test level status scrape job
  - job_name: sipfront_test_99_status
    scheme: https
    scrape_interval: 60s
    scrape_timeout: 50s
    metrics_path: /prometheus/tests/99/status/minute/stopped_at
    basic_auth:
      username: your-public-api-key
      password: your-secret-api-key
    static_configs:
      - targets: ['app.sipfront.com']
Configure a project level status scrape job
  - job_name: sipfront_project_77_status
    scheme: https
    scrape_interval: 60s
    scrape_timeout: 50s
    metrics_path: /prometheus/projects/77/status/minute/stopped_at
    basic_auth:
      username: your-public-api-key
      password: your-secret-api-key
    static_configs:
      - targets: ['app.sipfront.com']
Configure a scrape job gather the test level status of each test of a project
  - job_name: sipfront_project_77_status
    scheme: https
    scrape_interval: 60s
    scrape_timeout: 50s
    metrics_path: /prometheus/projects/77/tests/status/minute/stopped_at
    basic_auth:
      username: your-public-api-key
      password: your-secret-api-key
    static_configs:
      - targets: ['app.sipfront.com']