Two of the corner-stones of Telecom Operations are passive monitoring and active testing.
Passive monitoring helps to troubleshoot issues when they appear by capturing the network traffic and present it via a user interface, so operations engineers can search for calls, view signaling flows and drill down into the signaling messages. Active testing on the other hand is simulating end user calls and measuring their various metrics to verify if call scenarios properly work and the quality is within your requirements.
These two mechanisms work best when applied tightly integrated with each other, so you can generate active test scenarios from calls captured on the passive monitoring system, and on the other hand troubleshoot captured calls which failed during active testing.
This series of blog posts focuses on how we deploy Homer as passive monitoring solution within the Sipfront infrastructure, which is based on AWS Fargate, a managed AWS ECS container service.
- Part 1: this post
- Part 2: Capturing Traffic in Kamailio and sending it to Homer
- Part 3 and further: will follow
About Homer 7
Homer 7 is an open source passive monitoring system, designed in a very modular way with several components acting together. It basically consists of capturing components integrating with your existing telco infrastructure, such as plugins for Kamailio and OpenSIPS SIP proxies and network capture agents to tap traffic directly on your network interfaces. Server components digest the captured traffic and write them into databases of your choice. The second part is various web interfaces and helpers for users to search and visualize the captured traffic.
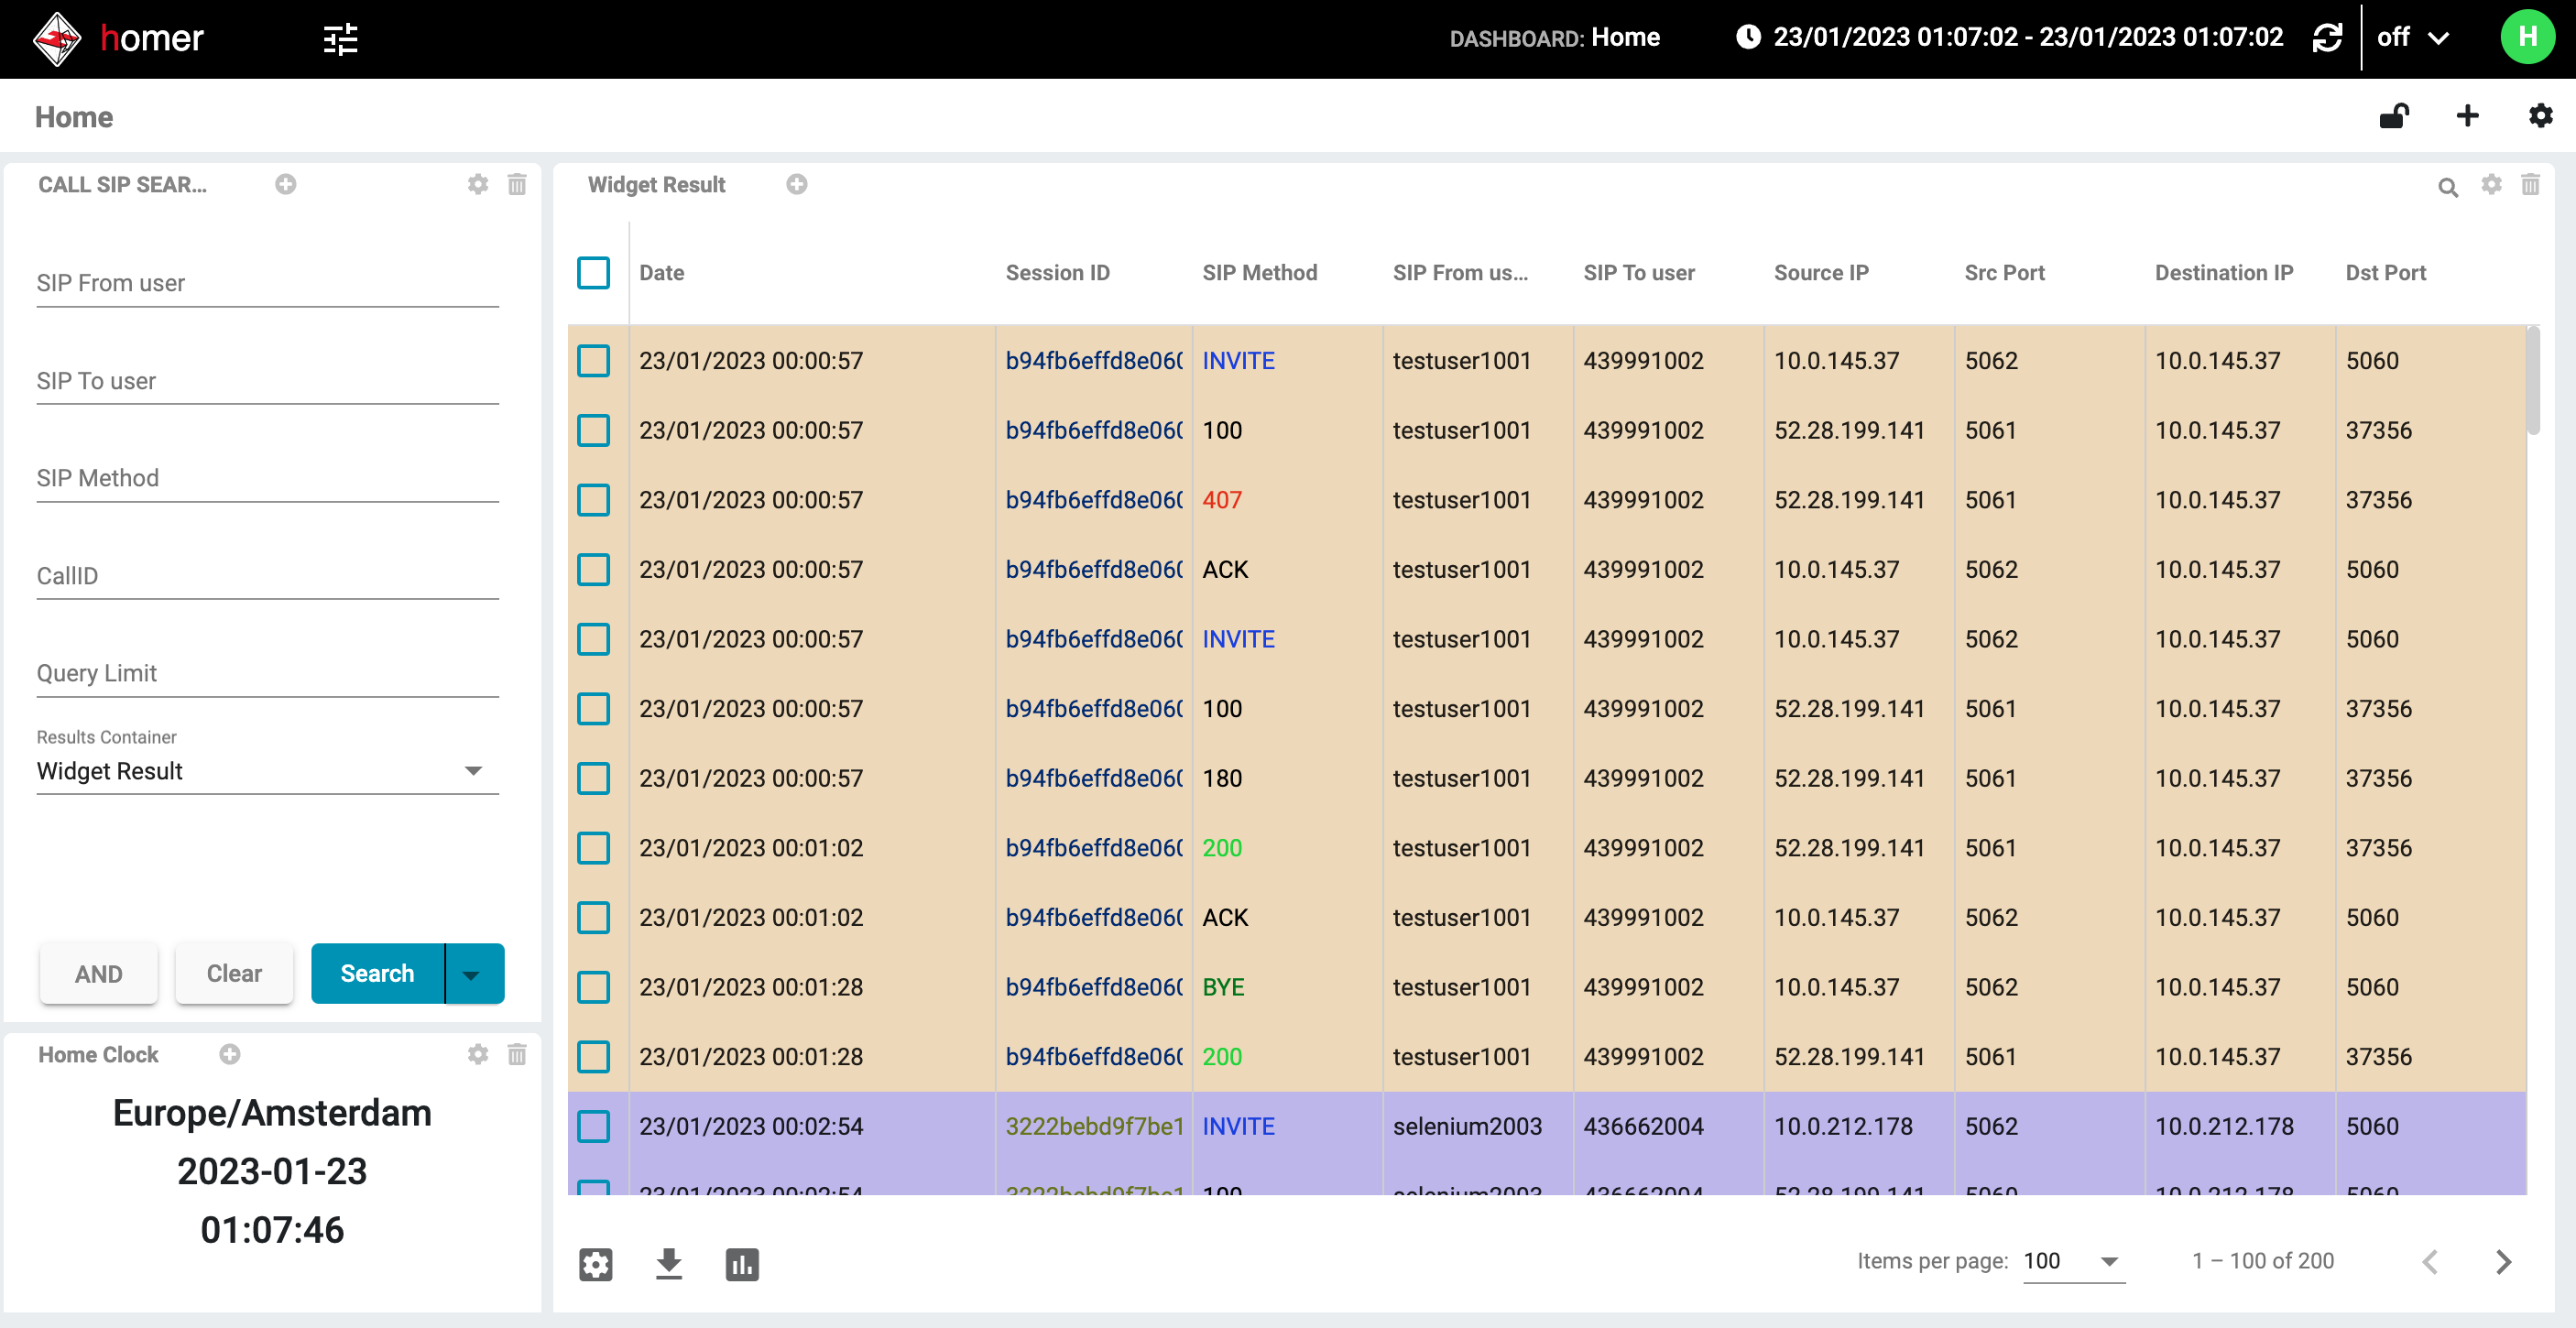
Homer 7 allows you to mix and match, for you to create the ideal deployment.
If you need support in setting up your ideal passive monitoring service, get in touch with the folks at QXIP, who are the authors and maintainers of Homer and who provide commercial support, as well as a commercial version called Hepic, which is essentially a Homer on steroids. Check them out.
Scope of this blog post
In this blog post, we will focus on the requirements, the selection of the needed components, and the high-level architecture.
Requirements
For Sipfront, we have the following requirements, driving the architecture of our deployment:
- Capture traffic on specific interfaces of our Kamailio proxy instances
- Capture encrypted SIP traffic routed via TLS
- Provide a full-blown Homer UI in our own private network for our engineers to troubleshoot all calls
- Provide a UI for our customers to inspect calls
- The UI is iframed into our app and must only show specific calls
- The user is not supposed to log into the Homer instance to see these calls
Architecture
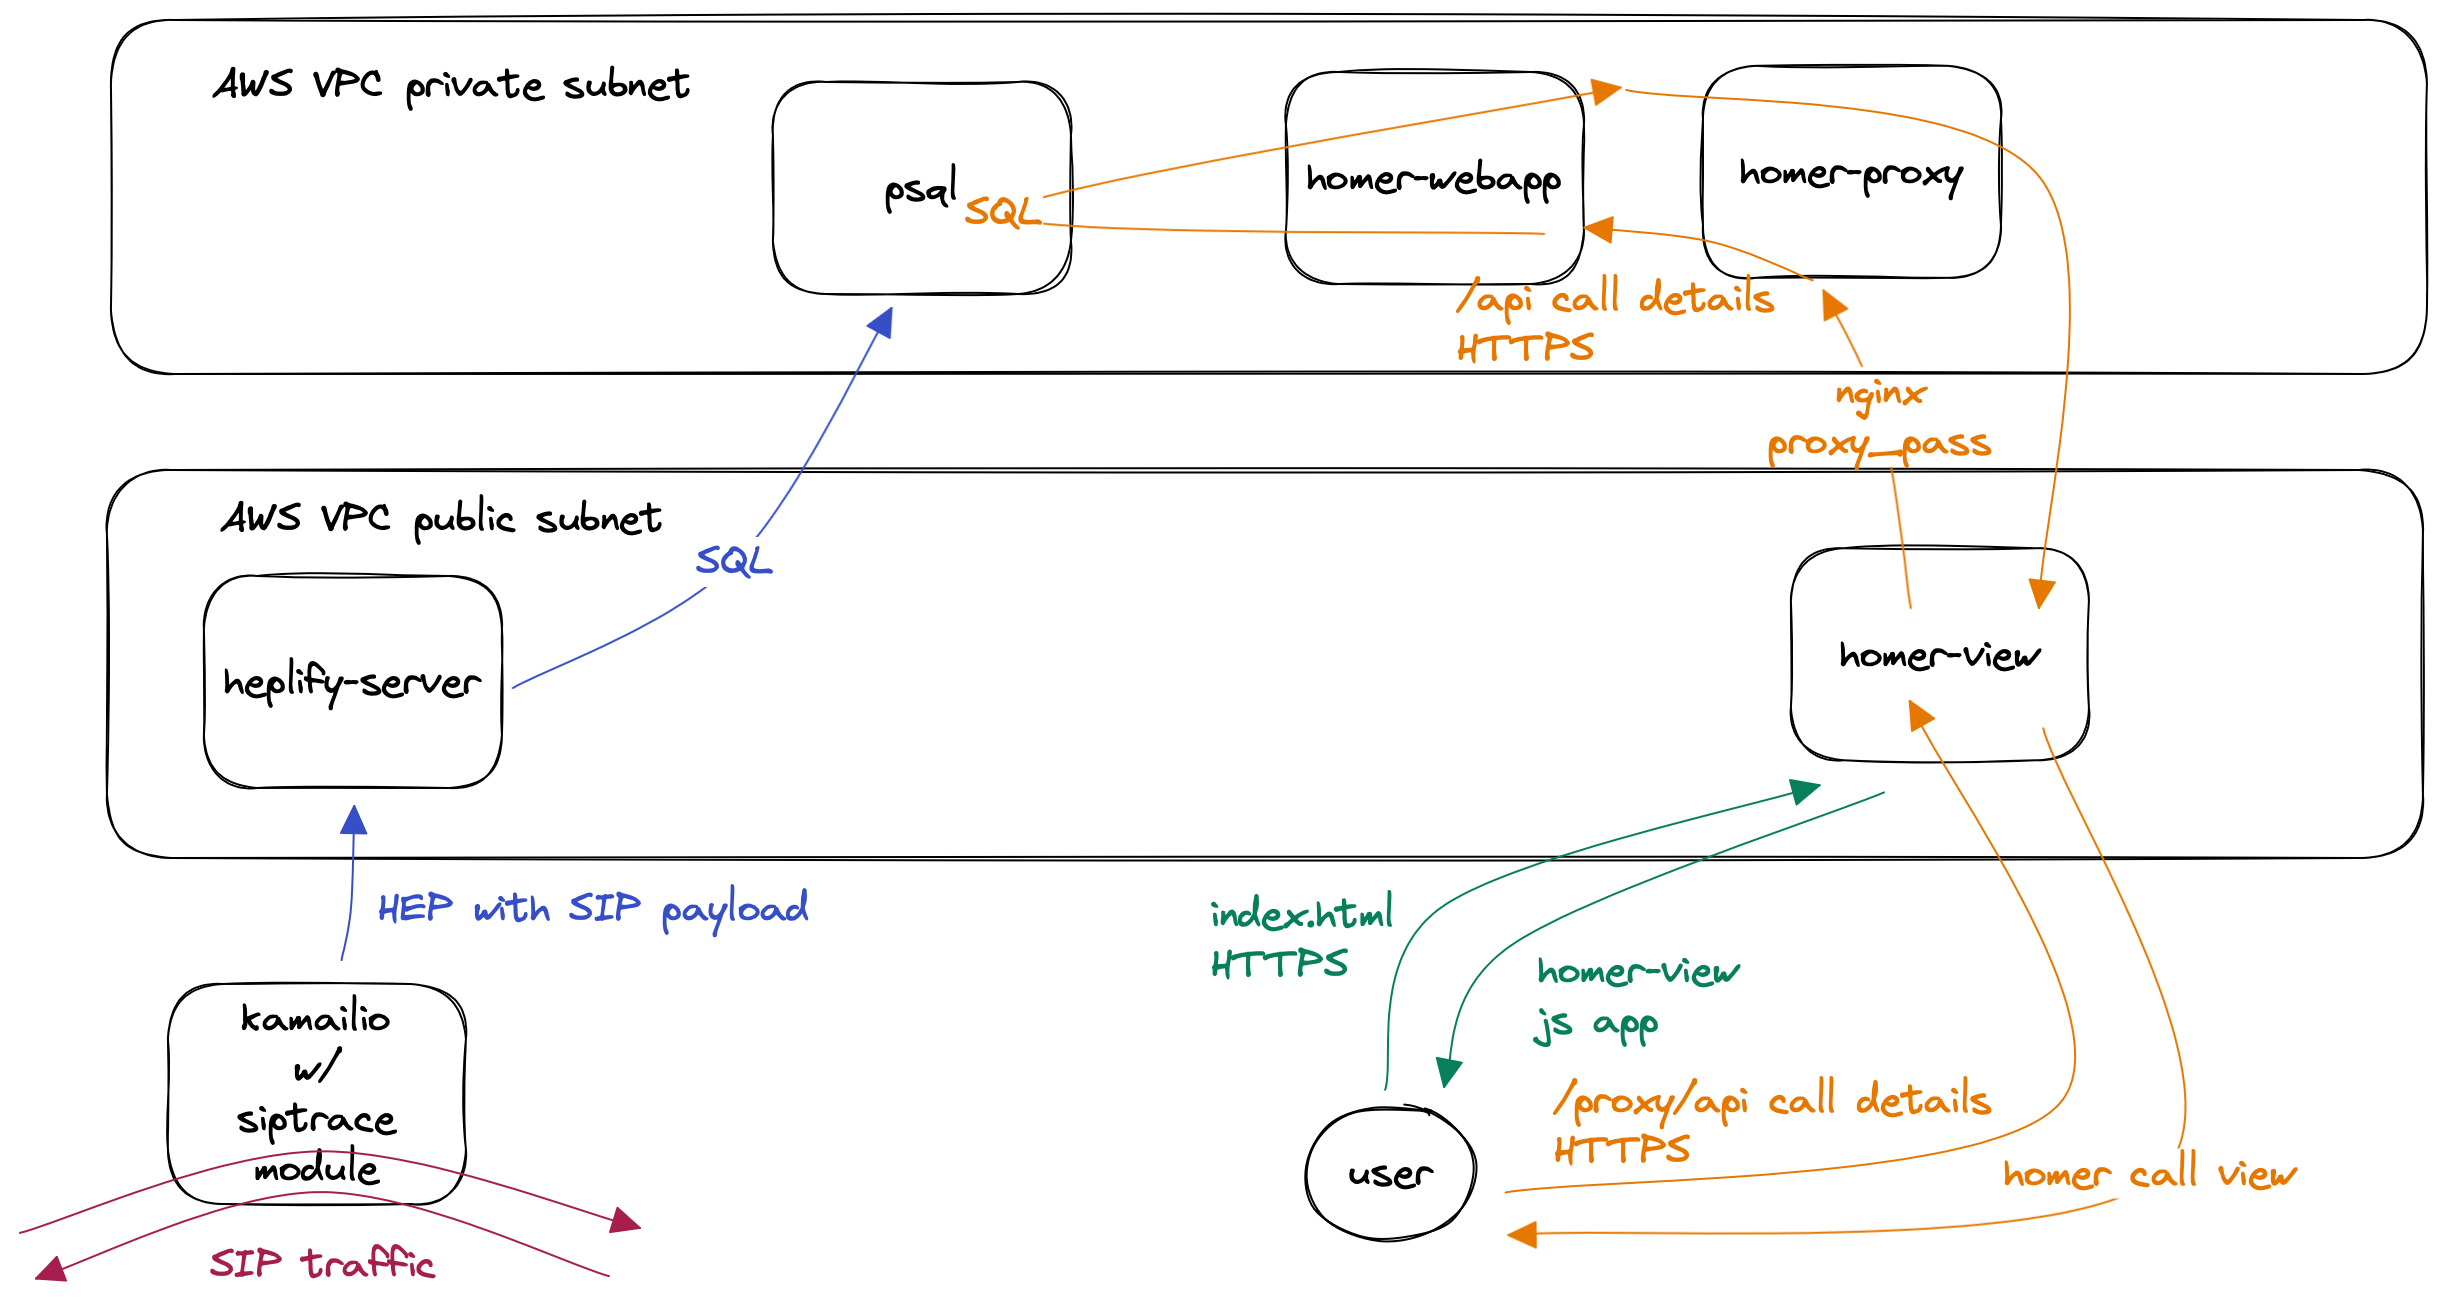
Based on the requirements, the architecture is outlined above. Let’s look at the components at play. In following blog posts, we’ll dive deeper into each of those components and their specific configuration.
siptrace module of kamailio to capture the traffic
Since we want to capture traffic in our kamailio instances, and also need to capture encrypted SIP traffic, we have to exfiltrate the traffic not on the network, but on a component that has both the knowledge about where traffic is coming from and going to, as well as having the content of the traffic available in unencrypted form.
Therefore we use the siptrace module of Kamailio, allowing us to specify which traffic is to be captured and which is not. This is because our Kamailio instances have an internal interface serving sipp and baresip, as well as an external interface towards the Internet. We’re only interested in the traffic sent to and received from the Internet, which can be IPv4 or IPv6, via UDP, TCP or TLS.
Alternatives would be captagent, hepagent and heplify to capture traffic directly on the network, but it’s not possible to capture encrypted traffic with these approaches.
heplify-server
The traffic captured from the siptrace module needs to end up in our database somehow. In our case it’s PostgreSQL, but Homer also offers MySQL support, and also optional additions such as InfluxDB, Prometheus, and Loki for ingesting metrics and log events. We will leave these out in our consideration.
So, to store our captured SIP traffic in our psql database, we use heplify-server.
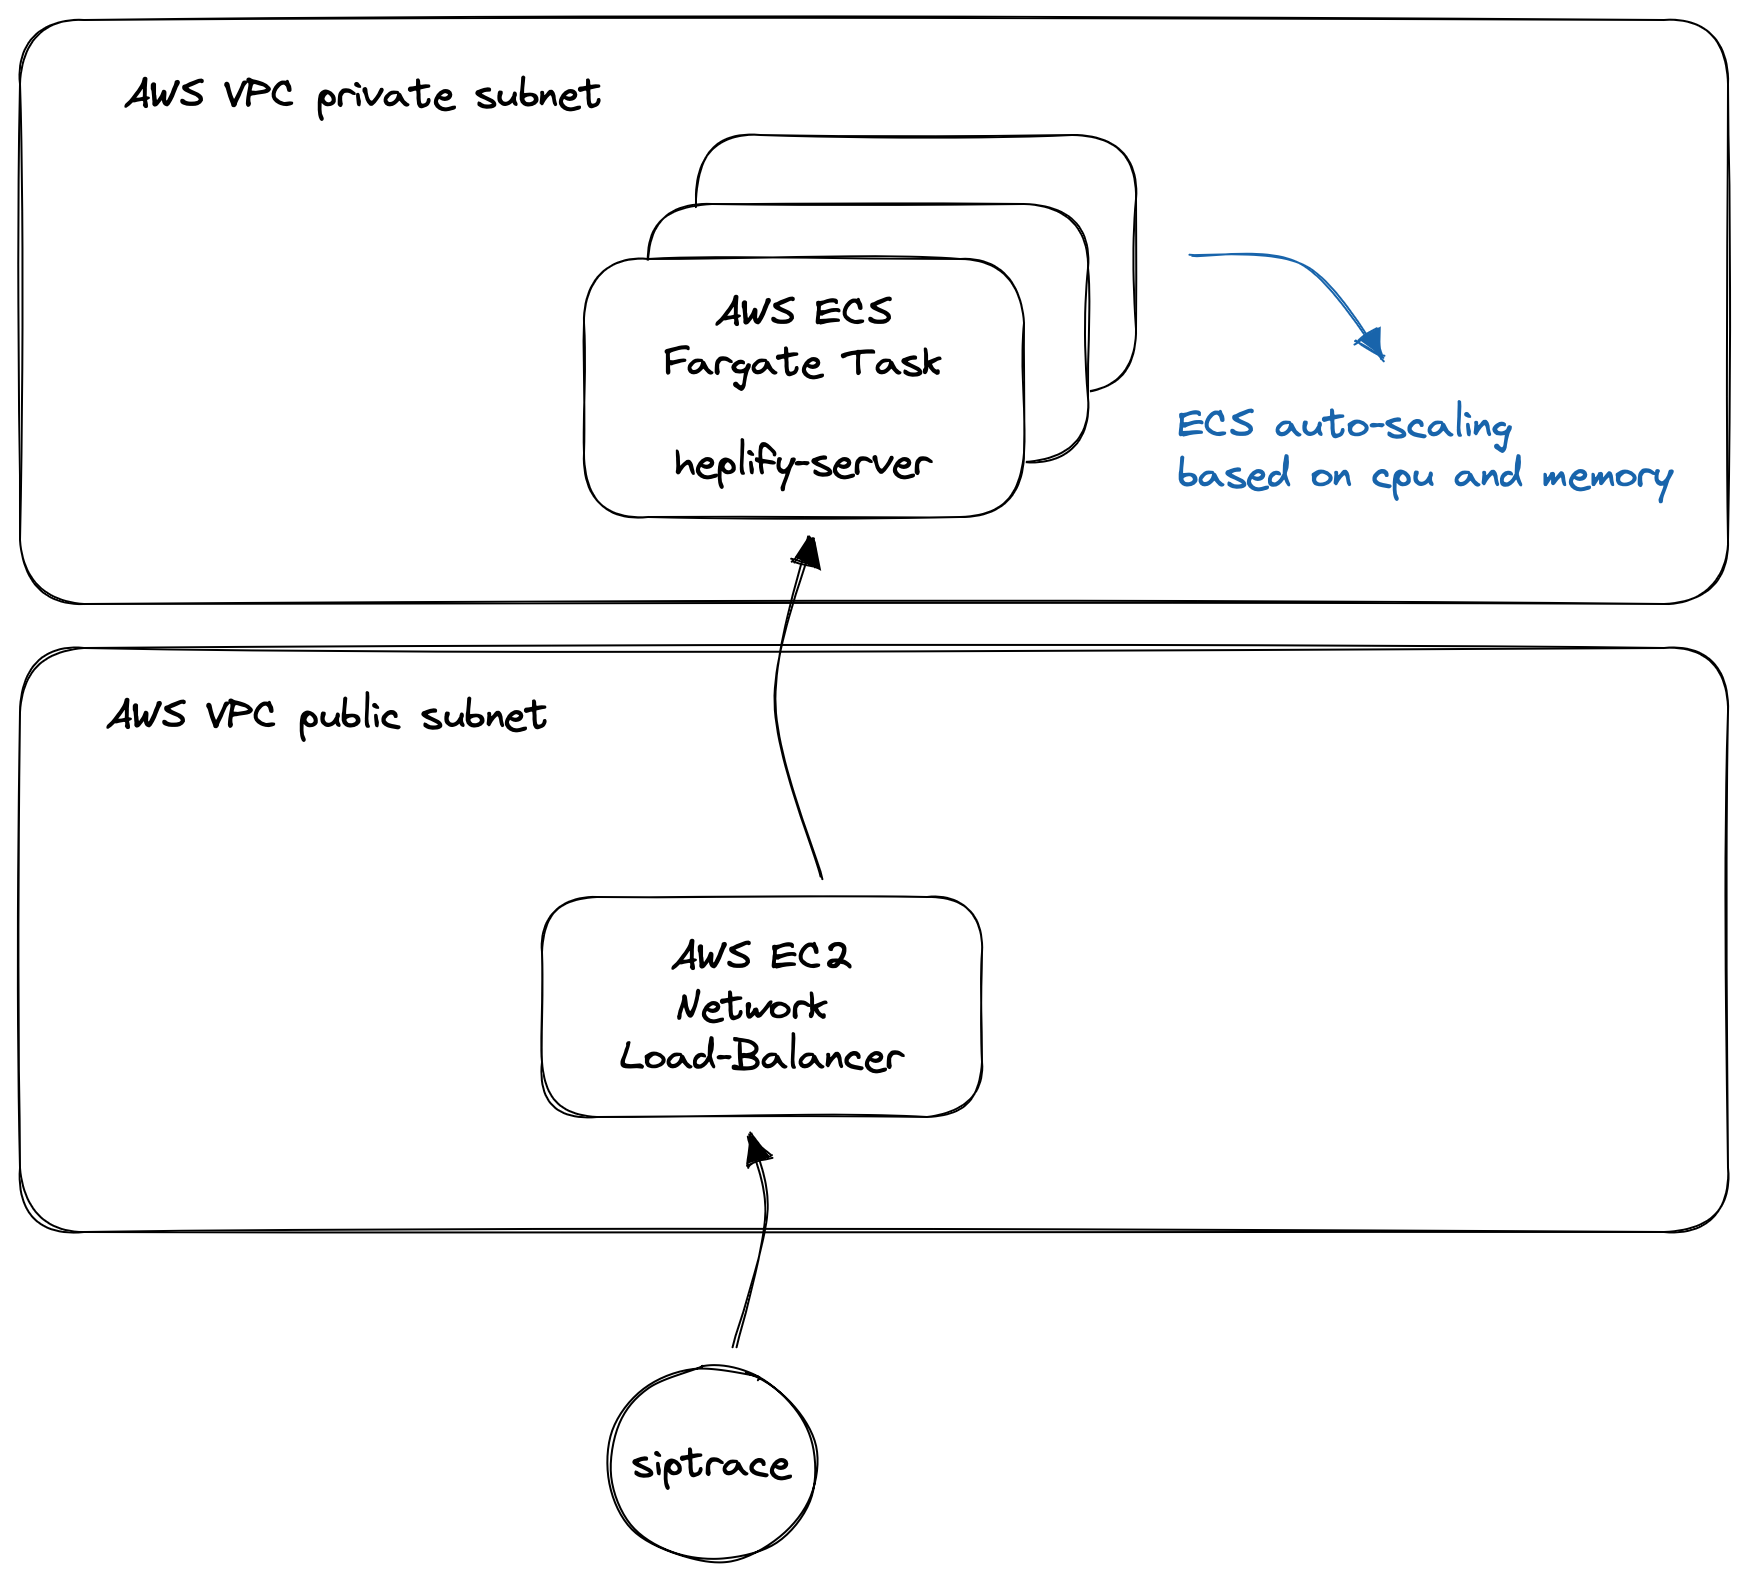
For scaling purposes (because our data ingress will grow and we’d like to scale automatically based on our heplify-server’s cpu and memory utilization), we put the container behind an AWS network load-balancer.
homer-webapp
For Sipfront engineers to troubleshoot individual calls, we deploy the homer-app component in our internal AWS network.
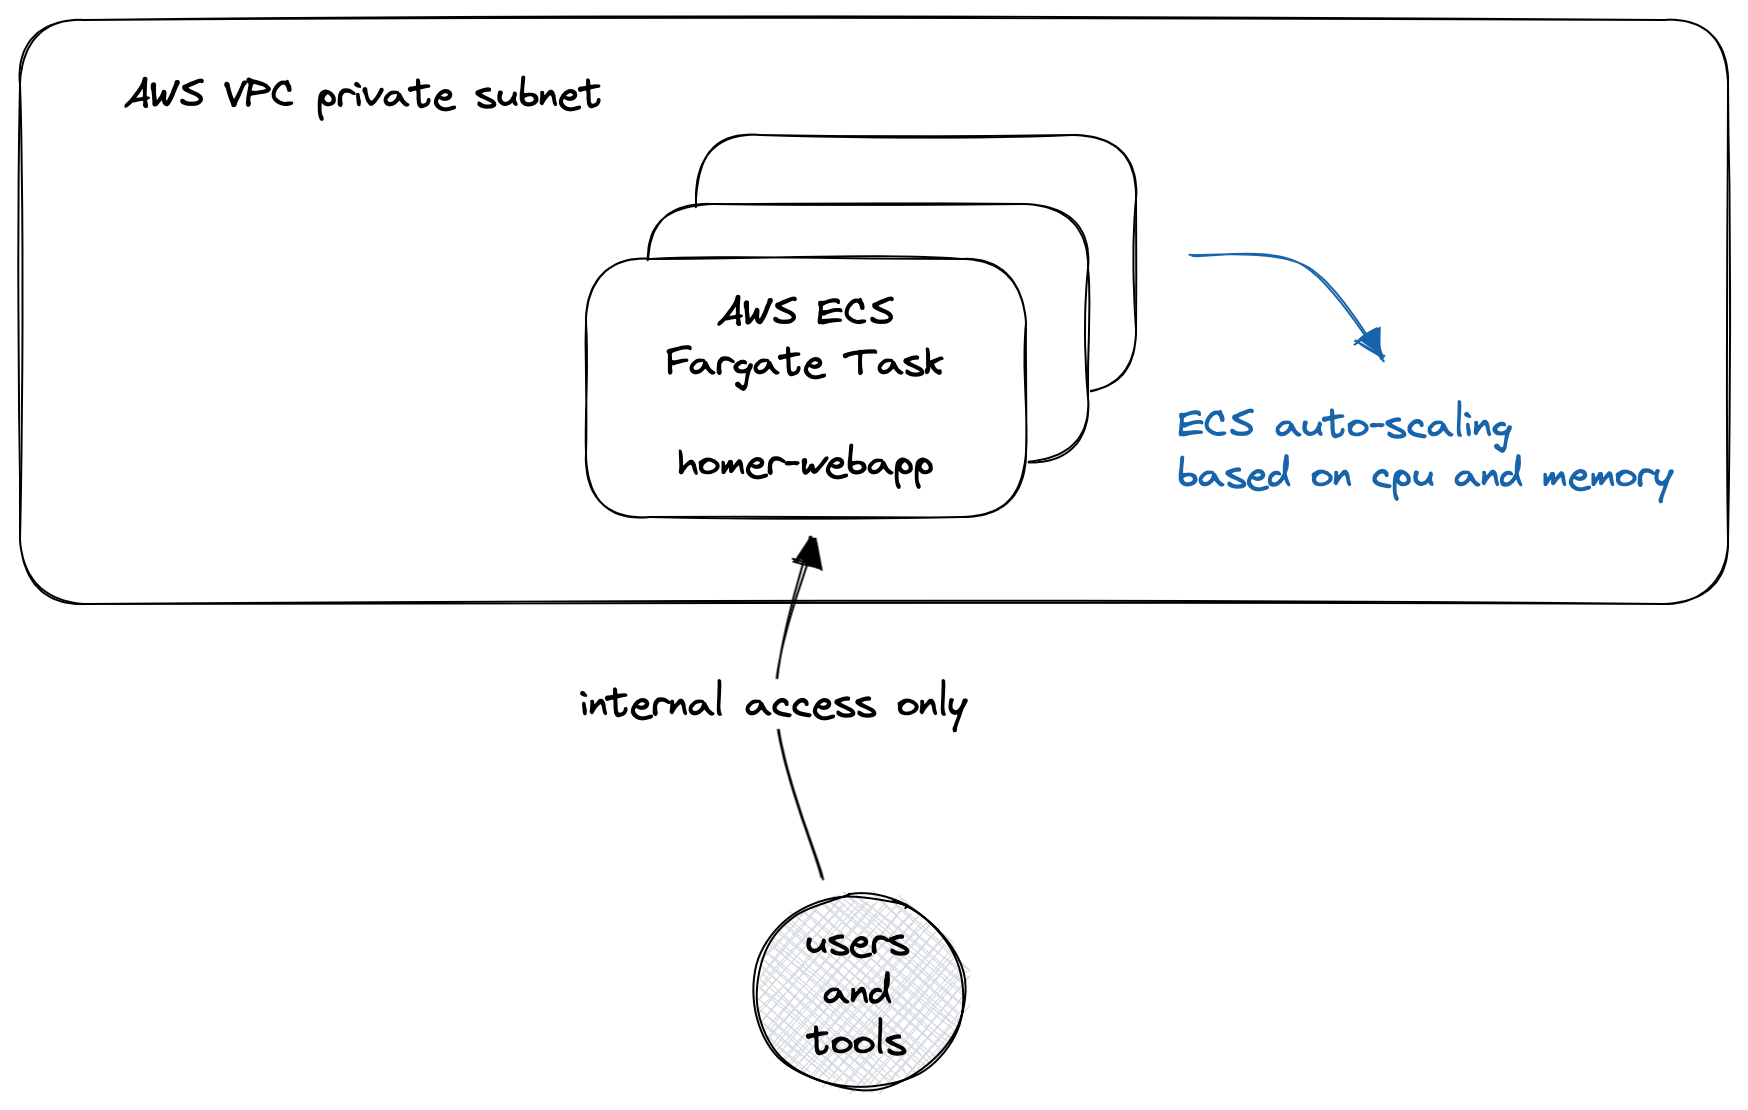
This component is only accessible from within our AWS subnets, or via our AWS Client VPN. Your requirements might vary if you need public access. Again we apply ECS auto-scaling for this service, but I’m not expecting a lot of traffic, since the majority of requests towards our Homer solution is traffic ingestion, and only a fraction of it is actually searching for and inspecting calls.
However, the homer-webapp is also providing the Homer API, which we’re leveraging the most, using the homer-view component.
homer-view and homer-view proxy
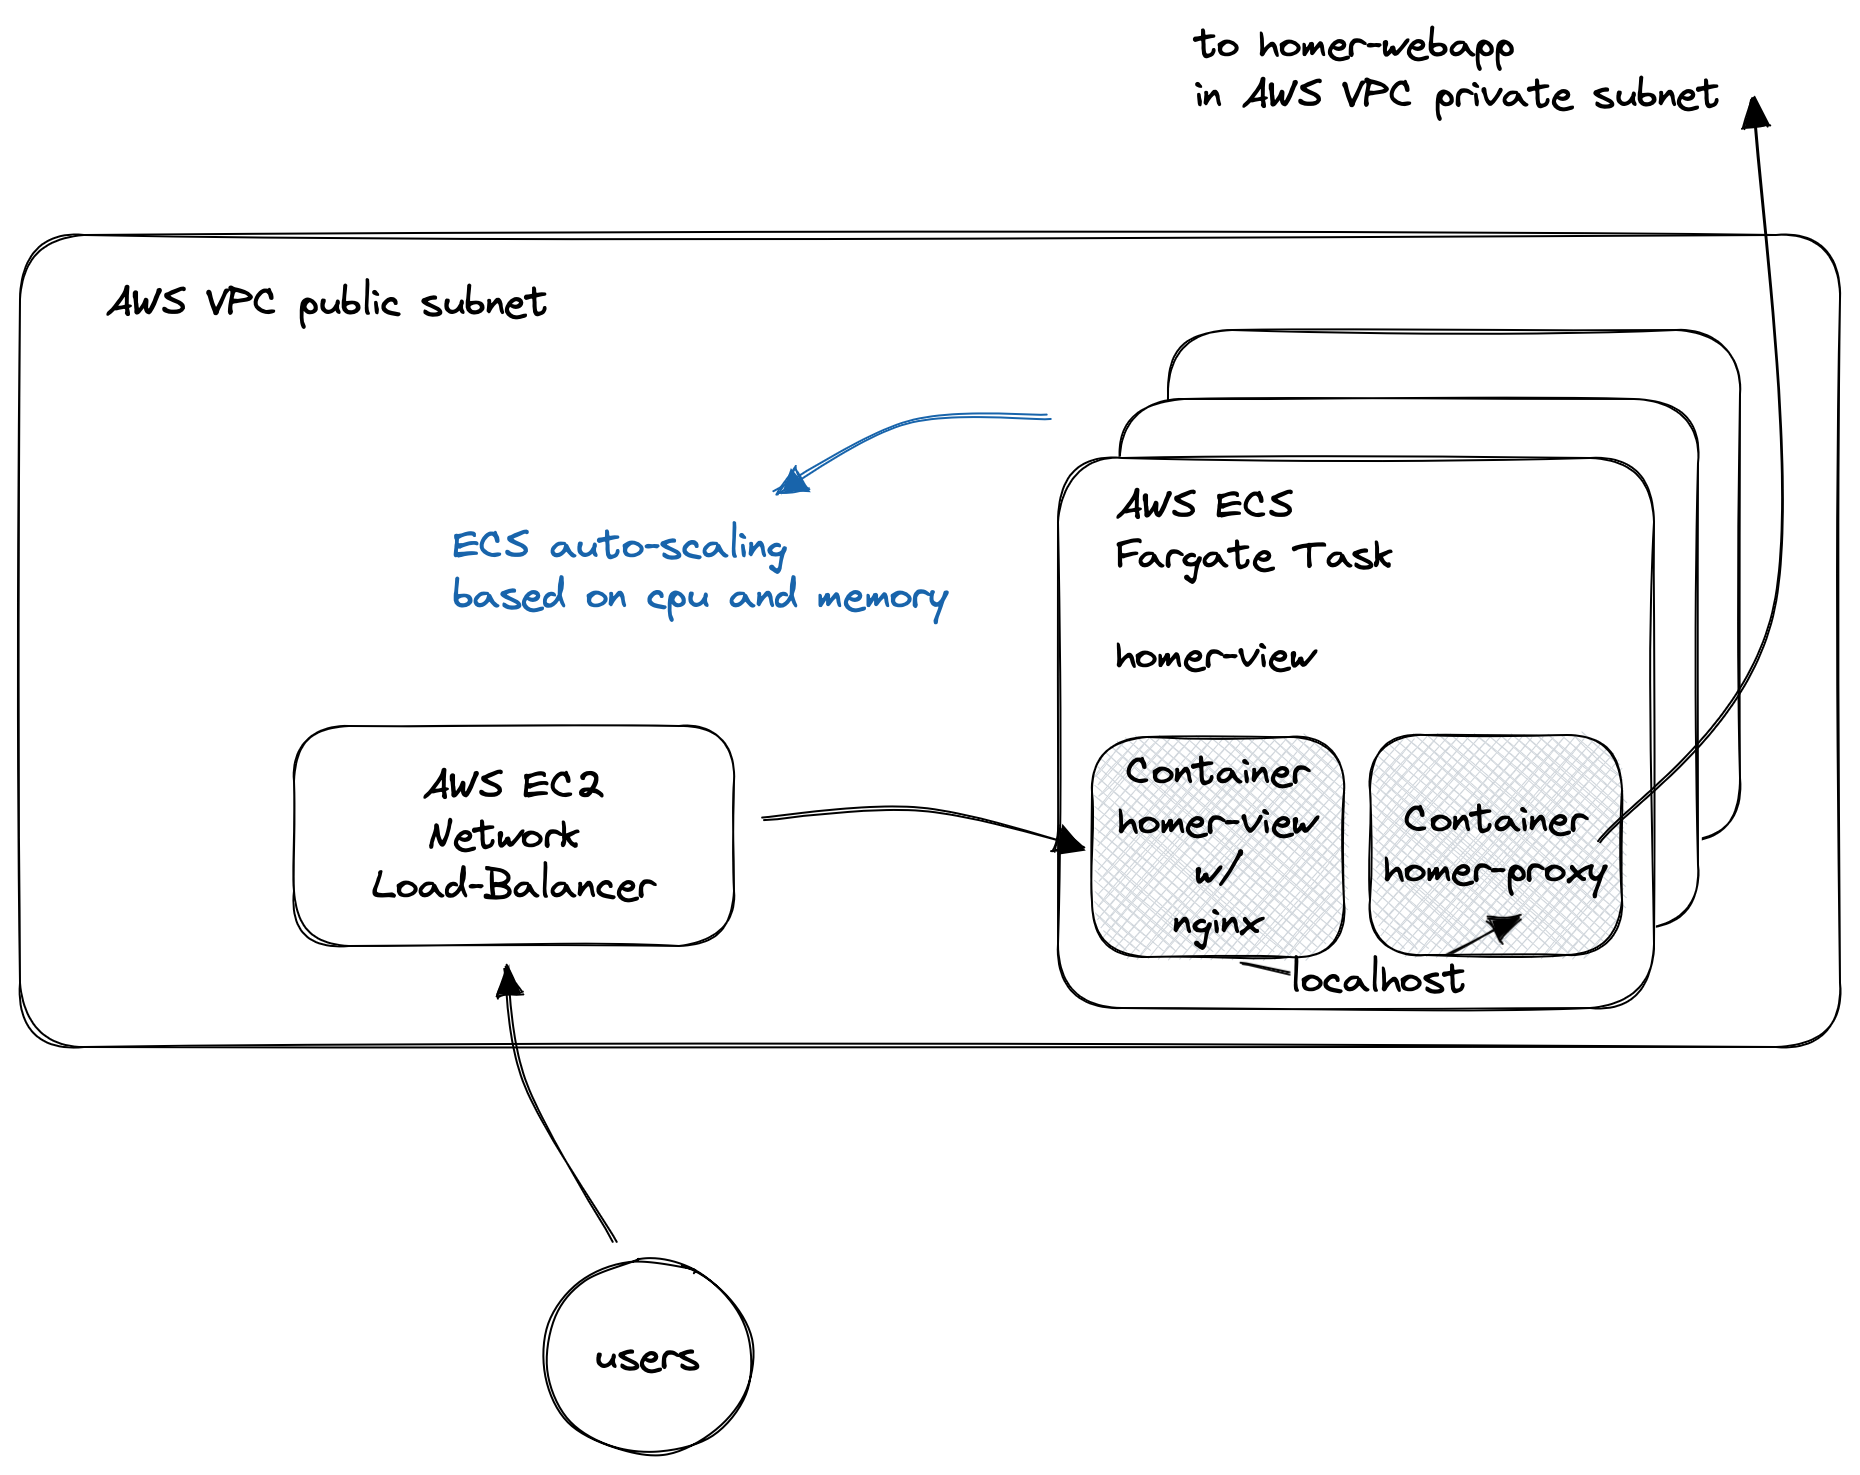
Sipfront customers can inspect the SIP signaling via the Sipfront web application, and therefore we embed homer-view into our test results pages. This needs to be publicly accessible, and our customers don’t get Homer access credentials, so they need to have a way to view their individual calls without a Homer account.
This is solved by using homer-view proxy.
For properly architecting these two components, you need to know that homer-view is an Angular web application, so the browser only downloads the assets like an index.html and the javascript files implementing the app. This web app then fetches the actual data via the Homer API, or in our case via the homer-view proxy performing the authentication towards the Homer API (and also the network bridging between the public and the private AWS network).
Having said that, homer-view just needs a web server serving its assets, and for our customers to only use one single point of contact for the application, we also use this nginx instance to reverse-proxy API requests to homer-view proxy, which in turn forwards them to the internal Homer API located in the homer-webapp component.
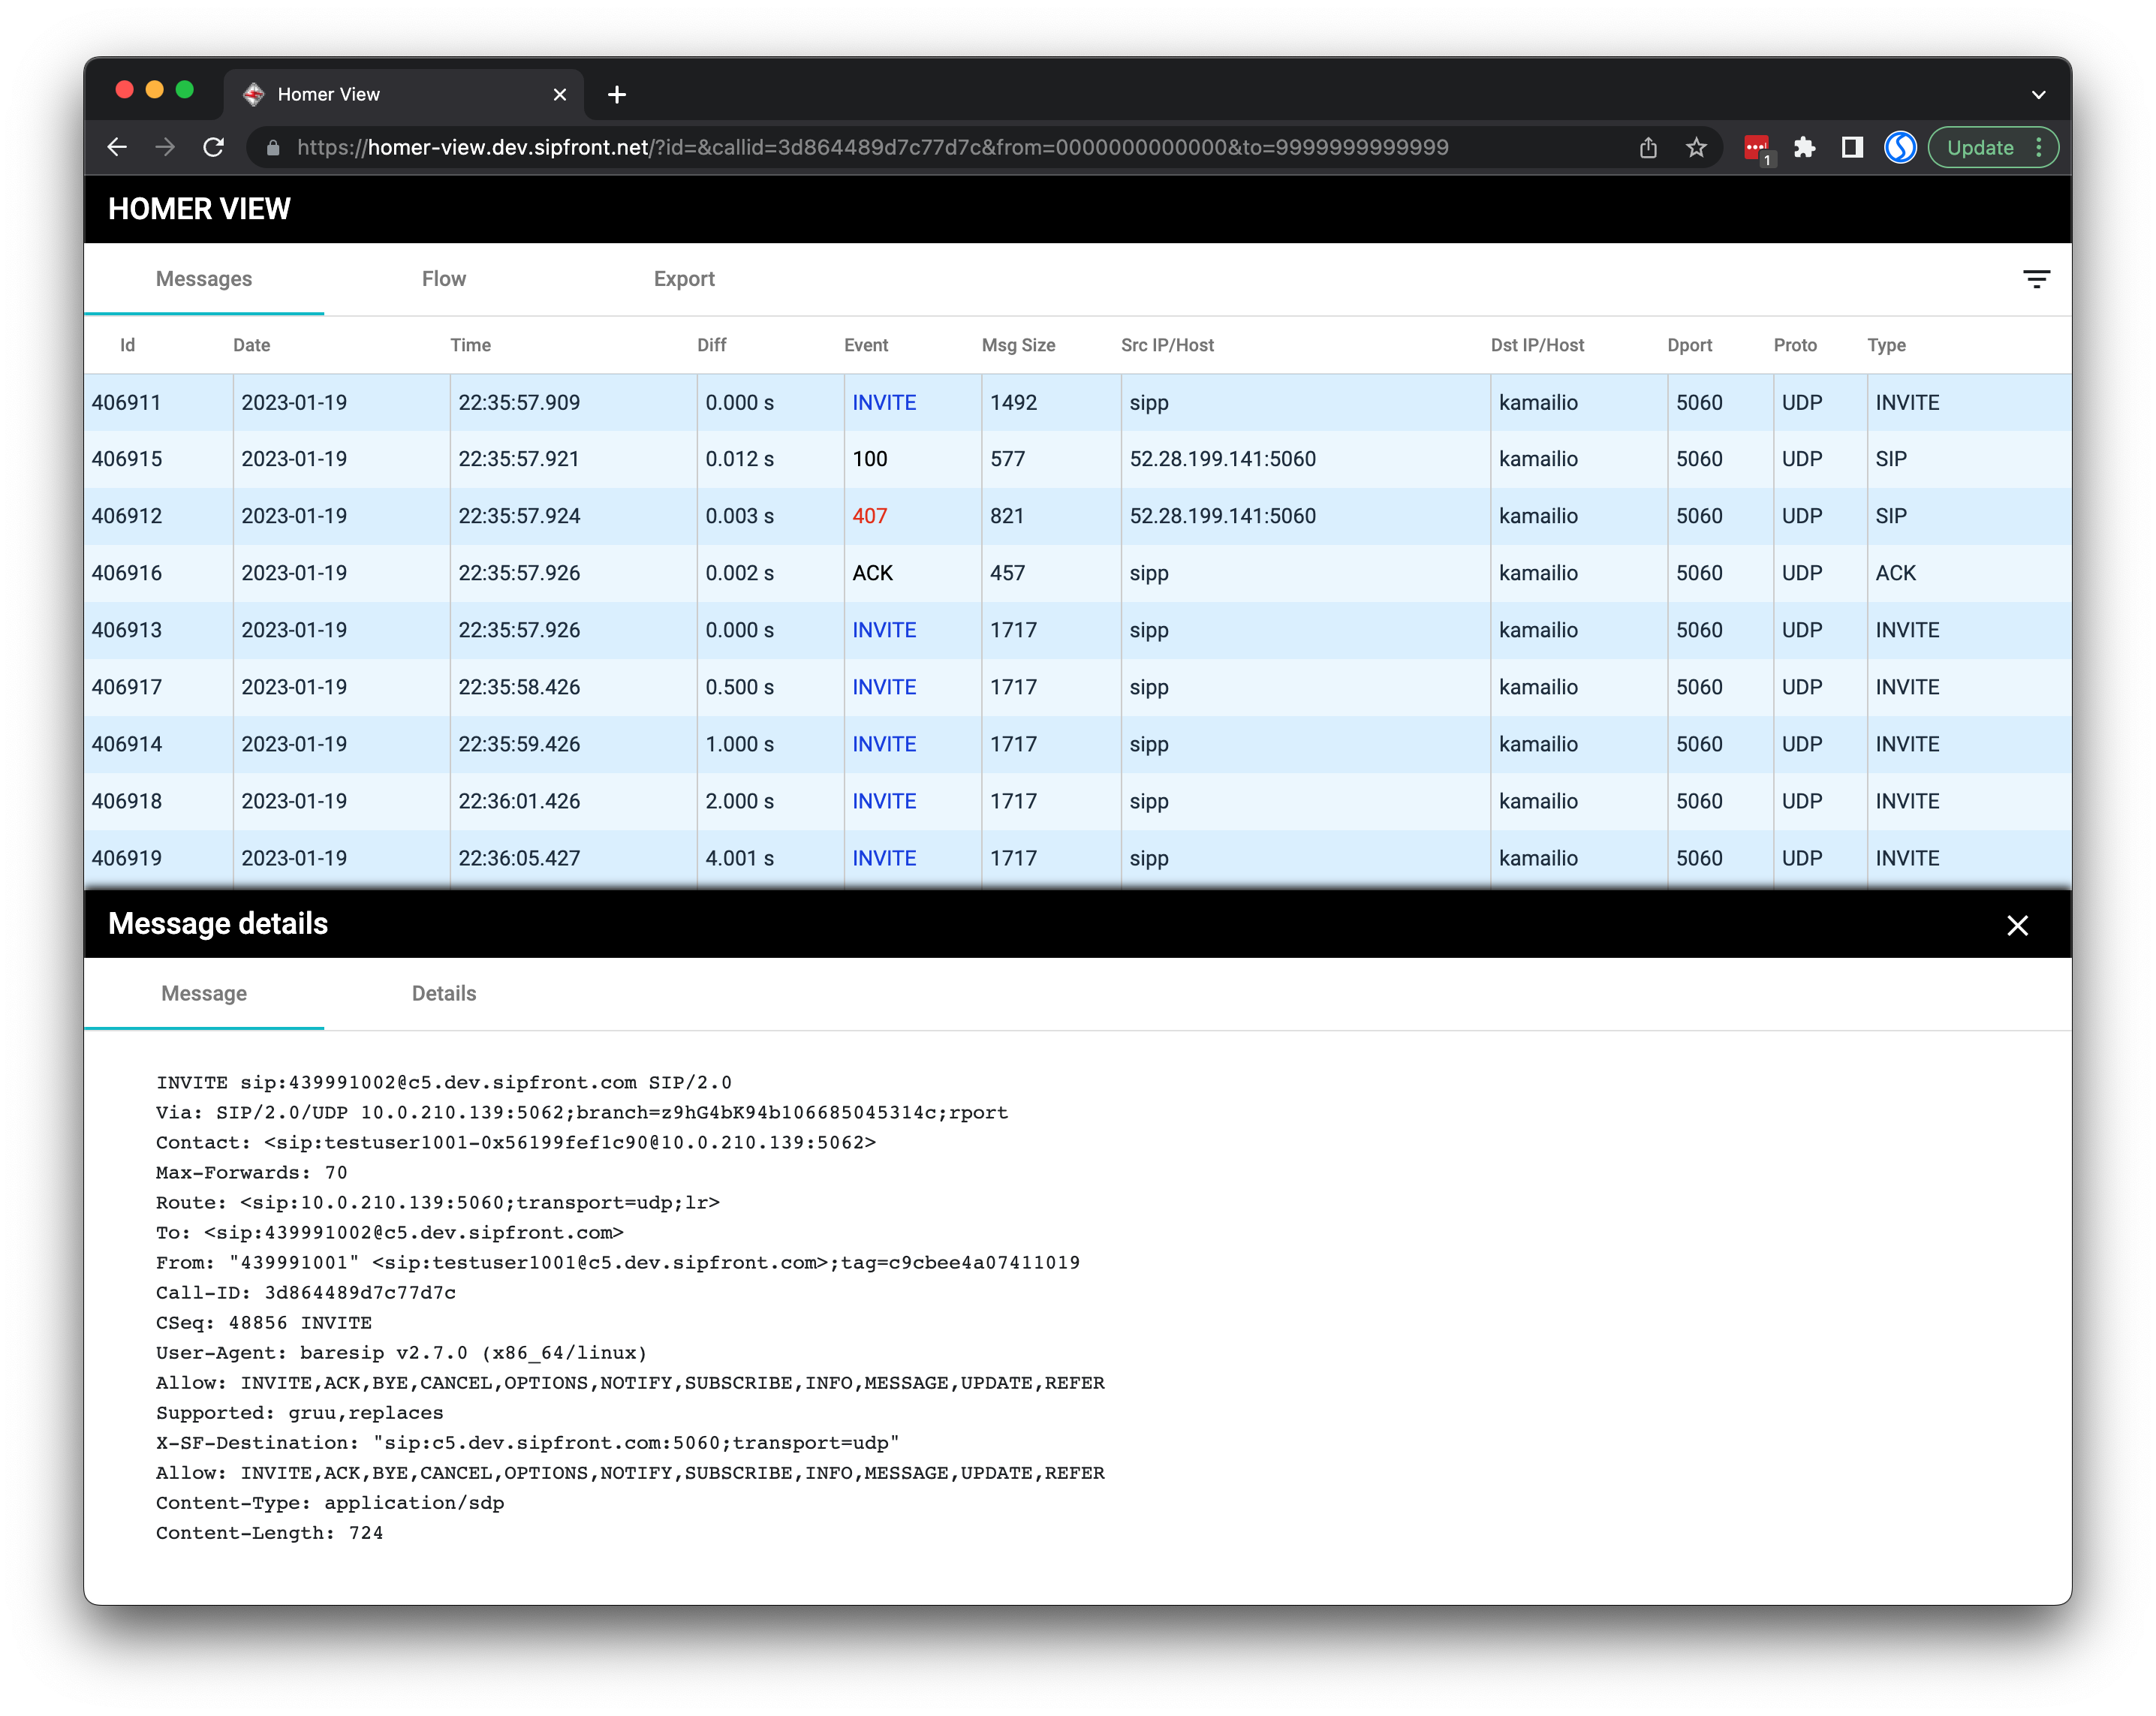
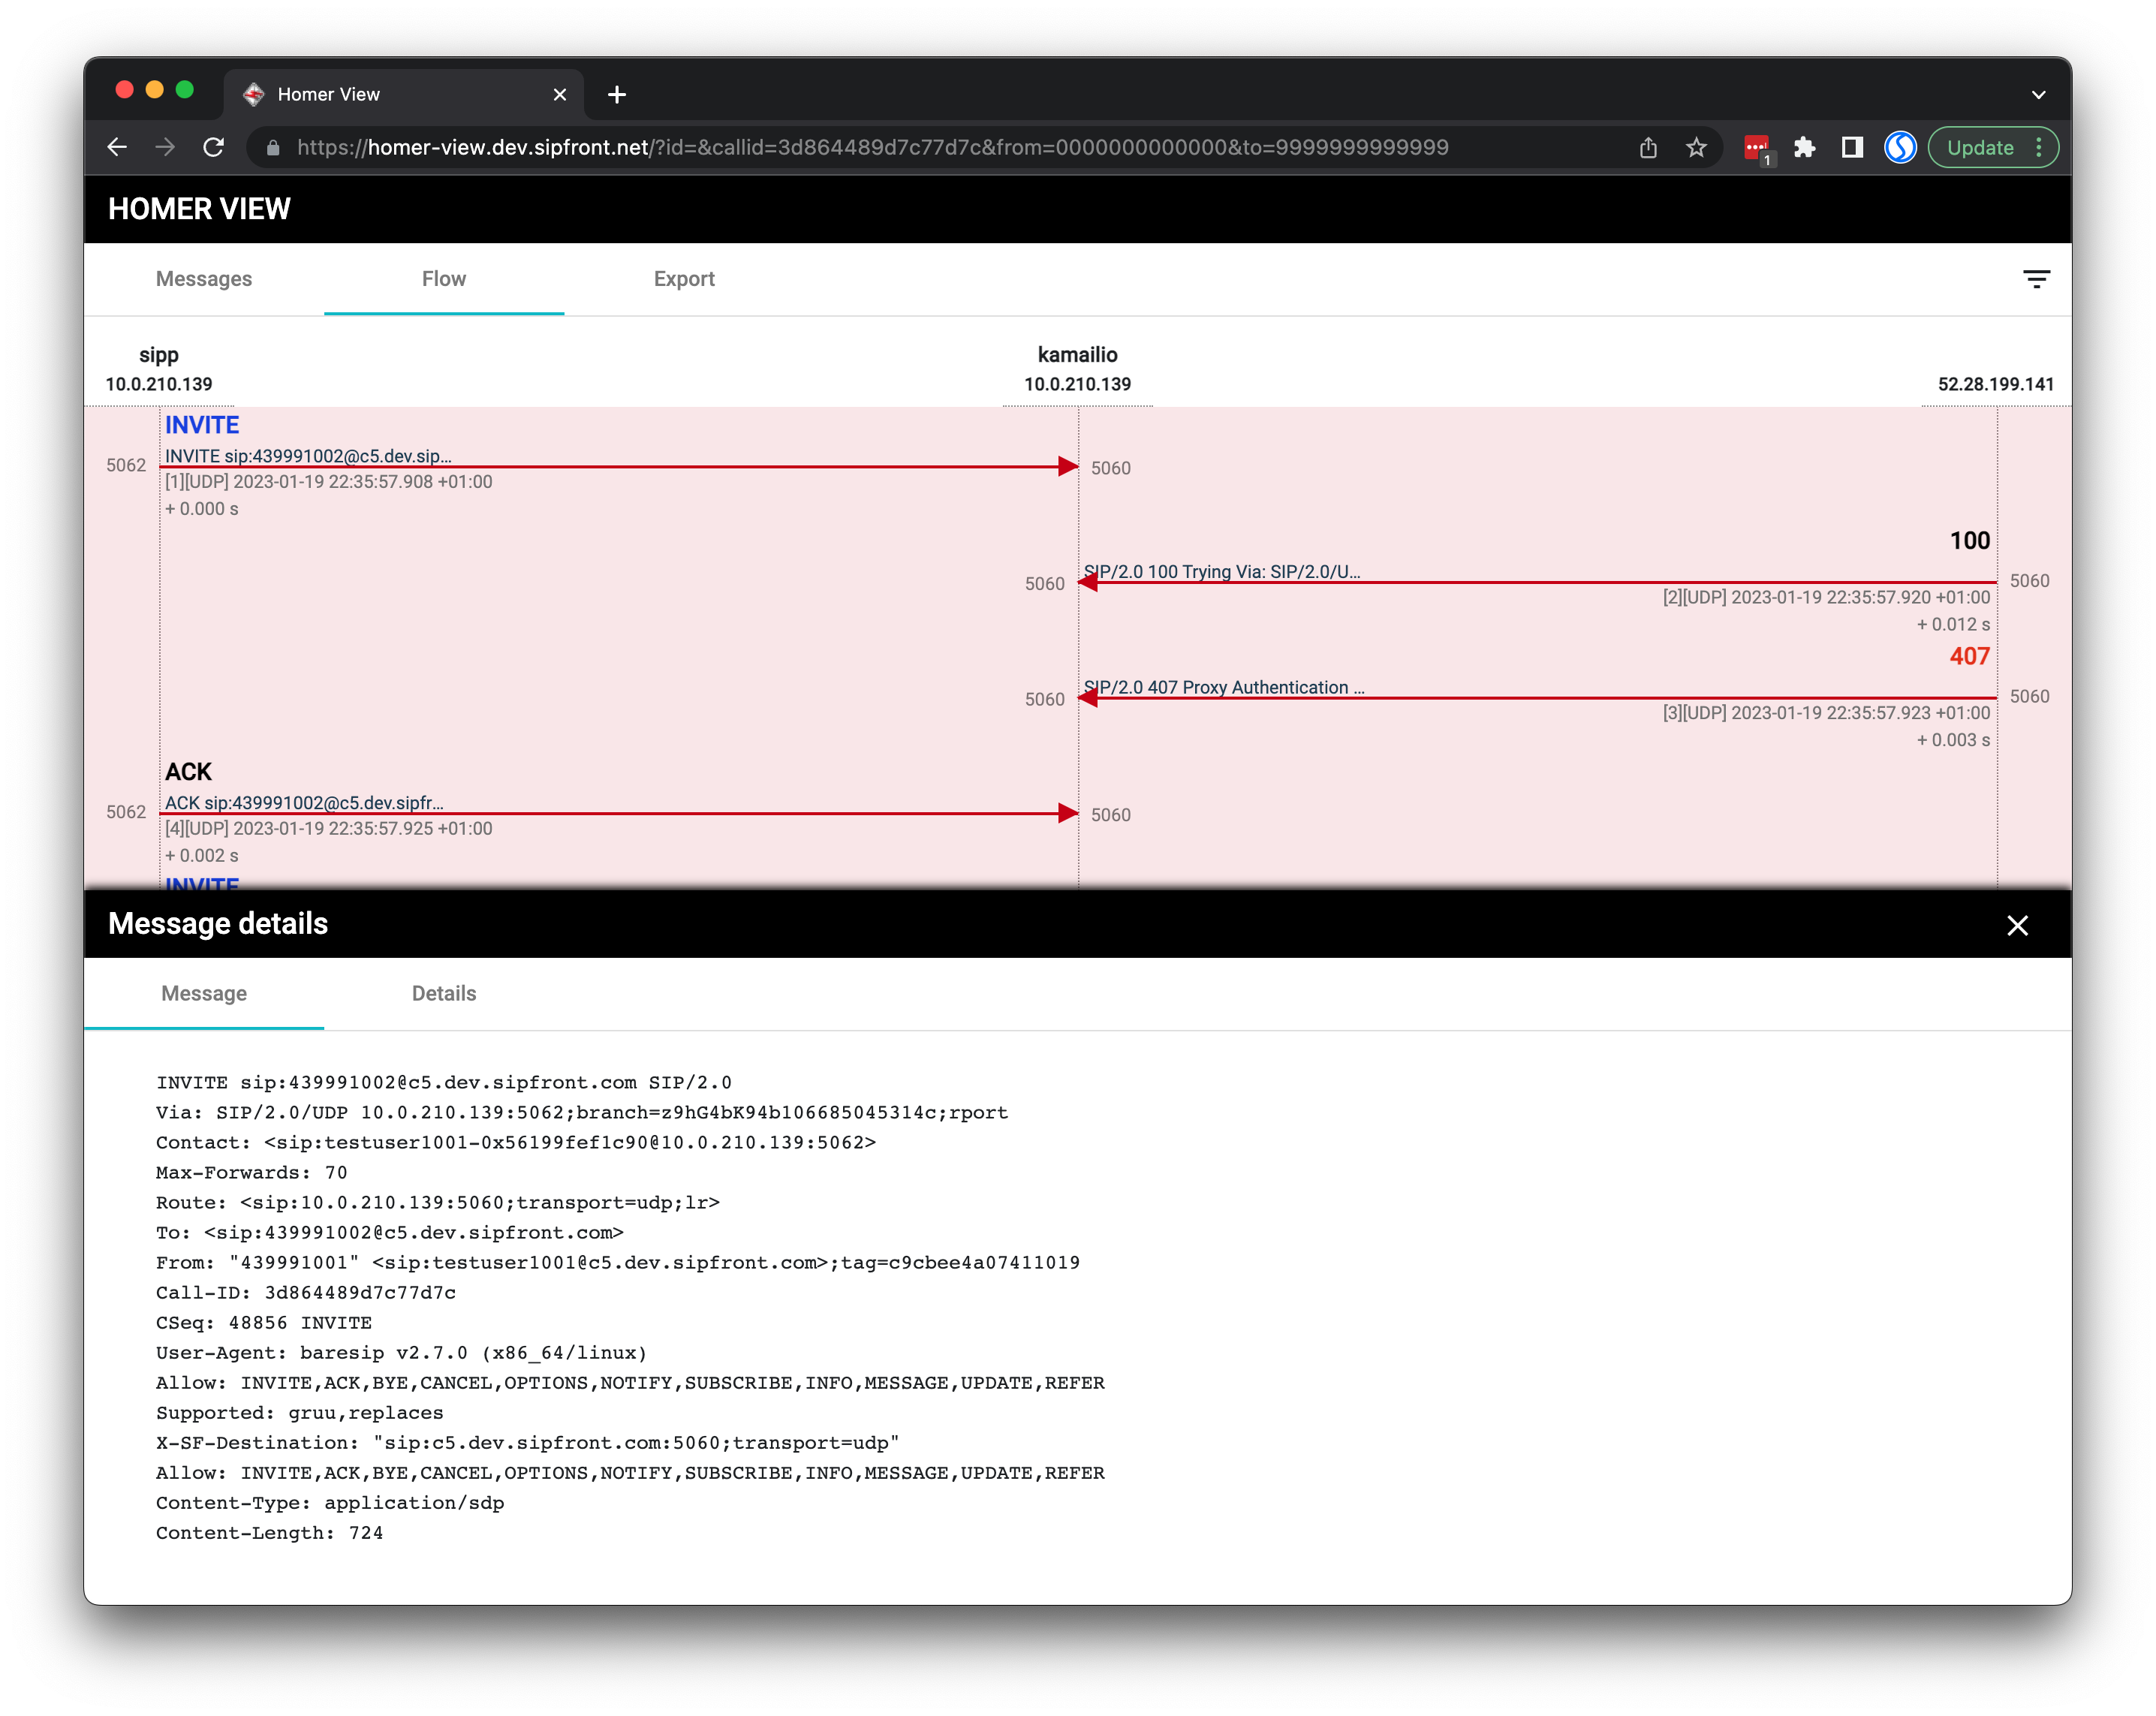
The homer-view component then looks like this when requested with a valid call-id and timestamps.
Conclusion
To sum it up, we deploy two public services in AWS ECS: one is the heplify-server to ingest capture traffic and store it to the database, and one is the homer-view service with an nginx container and the proxy sidecar to provide public access to individual calls.
The actual homer-webapp providing you with a full-blown UI for admins to search for any ingested call is hidden in our private AWS network.
The good thing about Homer 7’s modular approach is that you can place the components individually as required, which is a huge plus. The downside is that you have to deal with quite a lot of different component, and sometimes it’s difficult to figure out which component does what and how it needs to be configured, as the documentation is sometimes vague.
This is the first part of a series of blog posts about deploying Homer. Follow me at LinkedIn to receive updates when new blog posts of this series are published.
Comments about your experience with deploying and running Homer, or passive monitoring solutions in general, are highly appreciated!
comments powered by Disqus